Study on the Iron Production Process through the Analysis of By‐Products Found at Jiǔdiàn Iron Production Site, China
Article information
Abstract
Jiǔdiàn iron production site in China is a relic smelting site, which in the past produced pig iron. In this study, scientific analysis of the smelting furnace and collected slag was conducted to reveal some aspects of the ancient Chinese smelting technique. A 3D model of the smelting furnace showed a narrow lower part and an upper section which increased in diameter upwards. Although the smelting furnace relic does not include the upper part and its complete shape cannot be predicted, the remaining part suggests that the furnace had a larger diameter in the central part compared to the upper and lower parts. Most of the collected slag was completely vitrified. Long prismatic fayalite was observed in the matrix of some samples. The iron particles contained phosphorus, which could not be discharged during smelting work. In addition, as the CaO/SiO2 ratio was 0.42 or lower in the results of the content analysis, no CaO slag former had been added. However, the ratio of CaO/SiO2 to Al2O3/SiO2 did not have a constant trend. This needs to be investigated in a further study.
1 INTRODUCTION
The ancient Korean iron culture has been thoroughly studied by archaeologists. The main trend is to classify and chronicle the types of iron relics through morphological study. However, such morphological study has limitations in understanding the ancient steel making techniques. To understand the development of the iron culture, the past steel making process needs to be investigated.
Although many smelting relics have been found in South Korea, unfortunately, there are no cases where a complete smelting furnace has been found; most cases only retain the bottoms of the furnaces. Therefore, the characteristics of ancient smelting furnaces are difficult to identify. Currently, various experimental studies are being conducted to recreate the ancient steel making techniques, However, the method, type of construction, and application of the ancient smelting furnace have not yet been clearly identified.
This study conducted 3D modelling of the smelting furnace of Jiǔdiàn iron production site and analyzed the slag collected around it, thereby attempting to disclose some aspects of the ancient Chinese indirect smelting technique.
Jiǔdiàn iron production site is located in Henan, Central China. As a relic of the Warring States period(B.C. 403~ B.C. 221), Jiǔdiàn iron production site is one of the most important iron manufacture locations among the metallurgic relics of ancient China. Discovered in 1987, the site area around this relic covers about 28,000 m2. Springwater flowing around the site and abundant ironstone constituted the best conditions for metal production. One smelting furnace, ironstone, ironware, earthenware for daily life, pottery, bricks and tiles were excavated in the site. As an indirect smelting relic producing pig iron, Jiǔdiàn iron production site provides valuable information regarding the metallurgic techniques of ancient China.
2 SUBJECTS AND METHODS
2.1 Study subjects
2.1.1 Smelting furnace
The smelting furnace of Jiǔdiàn iron production site is the oldest in China(Figure 1). It has a basal diameter of 1.6 m, a middle diameter of 2.17 m and a height of 2.14 m. Being an elliptical furnace, it lost its upper part, but the remaining part is relatively intact. The current protecting canopy was built in 1976. Currently, the smelting furnace is surrounded by cement stairs and the access to it is restricted.
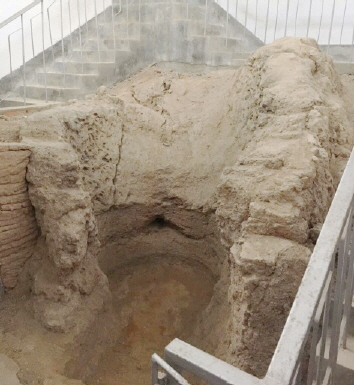
Jiǔdiàn iron production site smelting furnace.
2.1.2 Slag
This study analyzed 6 slag samples collected near Jiǔdiàn iron production site(Figure 2). The samples were selected by visual inspection and classified according to color and shape of slags.

Slag samples collected near Jiǔdiàn iron production site. (A) No. 1, (B) No. 2, (C) No. 3, (D) No. 4, (E) No. 5, (F) No. 6.
Slag samples No. 1~3 were glassy slag created at high temperatures, while No. 4∼6 were slag generated within the furnace.
2.2 Study method
2.2.1 3D modeling
A 3D model of the smelting furnace was constructed using terrestrial photogrammetry. Still photographs were taken by manually adjusting the front-to-back and leftto- right overlaps at a certain distance from the site. In addition, the SIFT algorithm of a dedicated software program (PhotoScan Professional, Agisoft) was implemented to match and coordinate feature points of each photograph, thereby creating an initial data point cloud. Then, a polygon mesh was fabricated and texture mapping was performed on this mesh, producing the 3D model of the furnace(Figure 3).
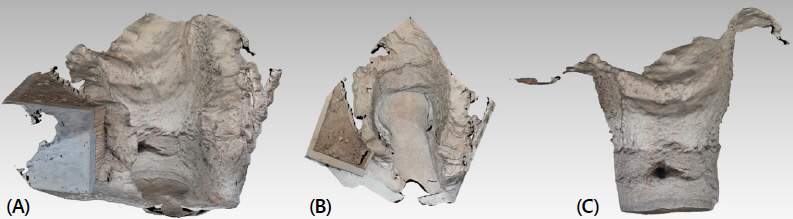
3D modelling images of the smelting furnace. (A) front, (B) top, (C) inside.
2.2.2 Analysis of main components
The main components of the collected slag samples were analyzed. To acquire pure samples, the slag surfaces were removed using a grinder. After that, the samples were deposited in ethyl alcohol and the remaining impurities were removed by an ultrasonic cleaner. After the samples were dried, they were pulverized. Finally, the main components were analyzed by wavelength dispersive X-ray fluorescence spectroscopy (S4 Pioneer, Bruker, Germany).
2.2.3 Microstructural analysis
Parts of the samples were collected using a diamond cutter to observe the microstructure of the slag. The samples were mounted in epoxy resin and polished; microstructures were observed by using a metallurgical microscope (DM2500M, LEICA, Germany). After that, a platinum(Pt) coating was applied to the samples in order to enhance the conductivity. Microstructural details were observed using a scanning electron microscope(MIRA3, TESCAN, Czech).
The chemical compositions of the microstructures were analyzed through an energy dispersive spectrometer (QUANTA300, BRUKER, Germany).
3 RESULTS
3.1 3D modeling
The result of the terrestrial photogrammetry provided high-resolution 3D shapes of the smelting furnace. Nevertheless, the complete exterior shape could not be obtained due to the protective canopy and stairs. The 3D modeling images indicated that the smelting furnace had a narrow bottom and the diameter increased upwards. There was also a tuyere in the front of the furnace. Since the upper part is lost, the complete shape of the furnace is unknown. However, the remaining part suggests that the central part of the furnace had a larger diameter than the upper and lower parts.
3.2 Main components
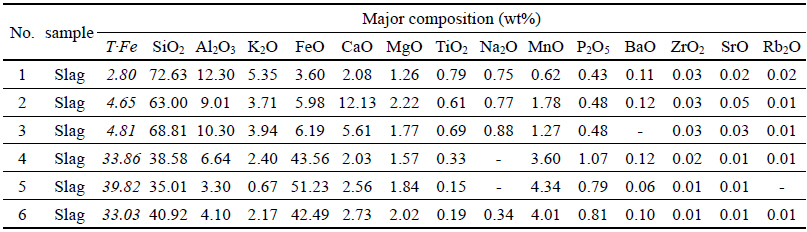
Table 1 presents the main components of the slag samples collected from Jiǔdiàn iron production site, which were analyzed by WD-XRF. The glassy slag samples No. 1 ∼3 had a high SiO2 content, while the remain slag samples No. 4∼6 contained high percentage of FeO. Total Fe content, which is one of the main components, is indicated by T Fe(Table 1), indicating the Fe residue in the slag. The lower the T Fe value, the higher the Fe recovery rate. The conventional T Fe of ancient slag samples ranges 30 to 50 wt%(Yoon, 1986). Among slag samples collected from Jiǔdiàn iron production site, samples No. 1∼3 showed a very low T Fe of 5 wt% or below, and the remaining slag samples had a T Fe value between 33.03∼39.82 wt%, which is within the conventional range of ancient smelting work.

WD-XRF analysis result for slag samples of Jiǔdiàn iron production site
The addition of slag former facilitates smelting work by decreasing the melting point and reducing viscosity. Accordingly, the amount of slag former tends to be inversely proportional to T Fe. The modified rate in ancient smelting works is usually between 17∼40 wt%(Yoon, 1986). A higher modified rate indicates more effective separation of metallic iron. Among slag samples collected from Jiǔdiàn iron production site, samples No. 1∼3 showed a very high modified rate of 86.36~89.52 wt%, and the remaining slag samples had an above-average modified rate of 42.71∼ 49.77 wt%.
3.3 Microstructure
3.3.1 Slag sample No. 1
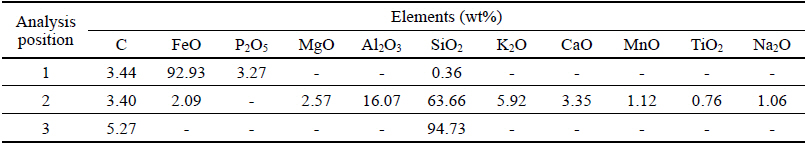
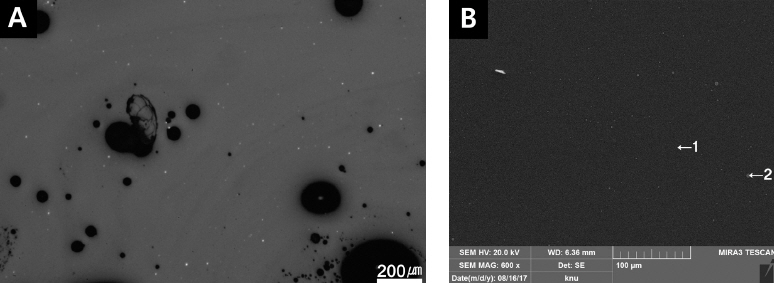
When slag sample No. 1 was observed through a metallurgical microscope, it was found to be mostly vitrified, and non-molten quartz particles were found along with metal particles(Figure 4A). The SEM-EDS analysis of the microstructures revealed iron oxides containing phosphorus(Point 1: Table 2, Figure 4B), a glassy base matrix(Point 2: Table 2, Figure 4B) and non-molten quartz particles (Point 3: Table 2, Figure 4B).
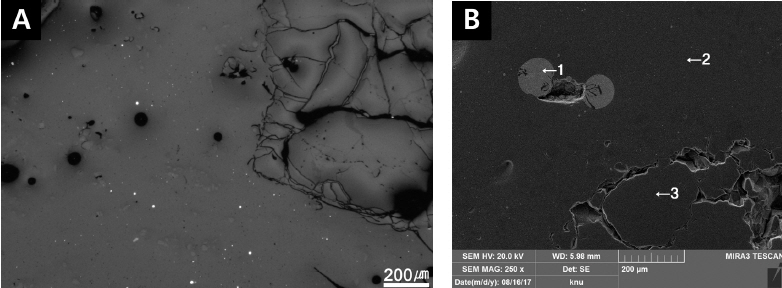
Microstructure of sample No. 1. (A) Photomicrograph of the sample, (B) SEM image and EDS analysis points.

EDS analysis results of slag sample No. 1
3.3.2 Slag sample No. 2
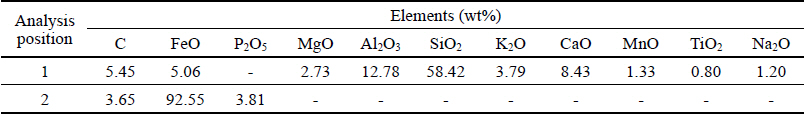
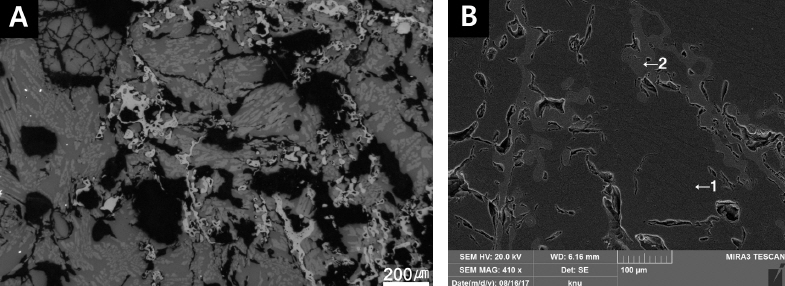
This sample was found to be completely vitrified when observed through the metallurgical microscope. Some metal particles were found in the glassy base matrix. More pores were observed in this sample than in the other glassy slag samples(Figure 5A). The SEM-EDS analysis revealed corroded iron particles containing phosphorus(Point 1: Table 3, Figure 5B), glassy base matrix(Point 2: Table 3, Figure 5B) and non-molten quartz particles(Point 3: Table 3, Figure 5B).
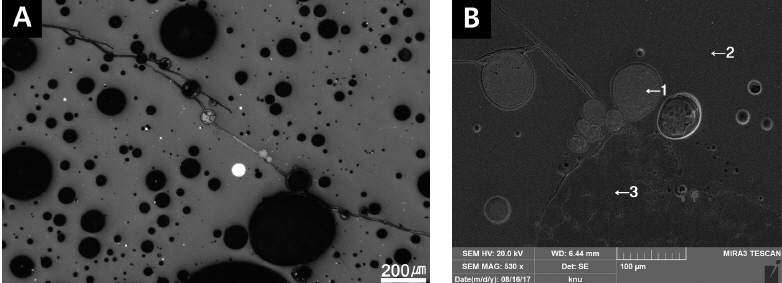
Microstructure of slag sample No. 2. (A) Photomicrographic image of the sample, (B) SEM image and EDS analysis points.

EDS analysis results of slag sample No. 2
3.3.3 Slag sample No. 3
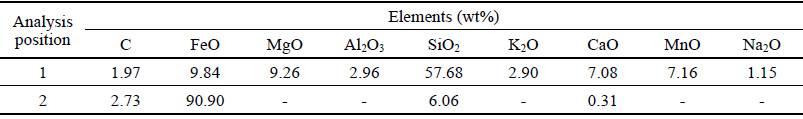
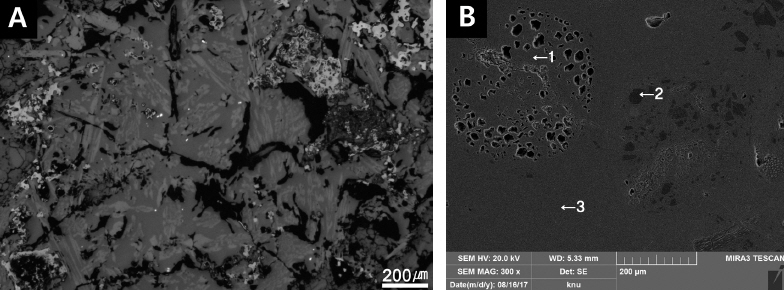
When the slag sample No. 3 was observed through a metallurgical microscope, complete vitrification was observed. Microscopic metal particles were found in the glassy base matrix(Figute 6A). The SEM-EDS analysis revealed a glassy base matrix(Point 1: Table 4, Figure 6B) and microscopic iron particles containing phosphorus(Point 2: Table 4, Figure 6B)
Microstructure of sample No. 3. (A) Photomicroscopic image taken through a metallurgical microscope, (B) SEM image and EDS analysis points.

EDS analysis results of sample No. 3
3.3.4 Slag sample No. 4
Figure 7A presents the microstructure of slag sample No. 4, as observed through a metallurgical microscope. Long prismatic fayalite crystals were distributed over the dark grey glassy base matrix and bright grey minerals were also found. The SEM-EDS analysis was conducted to find the different microstructural components and solid solution (Table 5, Figure 7B).
Slag sample No. 4’s microstructure. (A) Photomicrograph of the sample’s microstructures, (B) SEM image and EDS analysis points.

EDS analysis results of slag sample No. 4
Point 1 indicates the glassy base matrix and Point 2 seems to be solid ferrous metals, which were not separated during smelting(Figure 7B).
3.3.5 Slag sample No. 5
Figure 8A shows the microstructures of slag sample No. 5. The sample was almost completely vitrified. Fayalite was found in some parts of the sample. Figure 8B indicates the SEM-EDS analysis points of the microstructure, the results of which are presented in Table 6 Fayalite(Point 1: Figure 8B) was broadly distributed over the glassy base matrix, which itself had a high iron content(Point 2: Figure 8B).

Microstructure of slag sample No. 5. (A) Image taken through the metallurgical microscope, (B) SEM image and EDS analysis points.

EDS analysis results of slag sample No. 5
3.3.6 Slag sample No. 6
Figure 9A shows the microstructures in the almost completely vitrified slag sample No. 6. Some fayalite crystals were observed that could not grow in the glassy base matrix. Corroded metals were also observed. Figure 9B indicates the SEM-EDS analysis points of the microstructure, while Table 7 presents the analysis result. In Figure 9B, points 1 and 3 are reduced iron and point 2 seems to be feldspars containing Na2O.
Microstructure of sample No. 6. (A) Microscopic photograph taken through a metallurgical microscope, (B) SEM image and EDS analysis points.

EDS analysis results of slag sample No. 6
4 DISCUSSION AND CONCLUSION
This study analyzed the smelting furnace and slag samples of Jiǔdiàn iron production site to reveal some aspects of ancient iron making techniques. The Jiǔdiàn iron production site smelting furnace has lost its upper section and some parts of the outer wall were plastered with cement, making the complete structure difficult to model. However, the 3D modelling images revealed that the furnace had a narrow bottom which increased in diameter upwards. There was also a tuyere in the front of the furnace. The overall shape of the furnace seemed to be similar to an entasis column, with the largest diameter in the central part and a smaller diameter in the upper and lower sections. These basic observations will be used to restore an ancient smelting furnace in the future.
Most of the slag samples collected near Jiǔdiàn iron production site were completely vitrified. Some samples showed long prismatic fayalite crystals in the base matrix. iron particles were found to contain phosphorus, which could not escape during smelting work.
In the modern iron making process, limestone is generally used as a slag former. When calcium oxide(CaO), generated by limestone, is combined with SiO2 from ironstone, this compound can be discharged as slag, as it has a lower specific gravity than molten pig iron(Park, 2004). According to a recent study, If the glassy base matrix of the slag samples is taken as a good estimation of the overall composition, the CaO/SiO2 ratio, which is over 0.42 in these samples(Figure 10) indicates that CaO slag former has been added(Lee, 2017). Moreover, if the ratio of CaO/SiO2 to Al2O3/SiO2 is 0.83 or less, slag former has been artificially added(Lee, 2017). However, the ratio of CaO/SiO2 to Al2O3/SiO2 did not have a constant trend. This needs to be investigated in a further study(Figure 11).

CaO/SiO2 ratio.
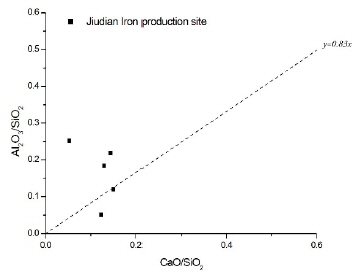
Ratio of CaO/SiO2 to Al2O3/SiO2.
As Jiǔdiàn Iron production site is an indirect smelting relic producing pig iron, the slag samples collected at Jiǔdiàn iron production site have the characteristics of indirect smelting slag. In South Korea, slag has been continuously investigated and research projects are being actively conducted. However, most of them focus on iron making by-products, which are generated by direct smelting. Moreover, studies regarding smelting techniques have concentrated on direct smelting techniques. In this regard, the results of this study will be useful for future studies on indirect smelting.
Acknowledgement
This work was supported by the Protected Research Support Program of the National Research Foundation of Korea (NRF-2016R1D1A2B03936071).