Comparison of Heated Charateristics of Smelting Experiment Furnace Wall Using Geothermometer and Cluster Analysis Method of XRD Data
Article information
Abstract
In this study, 91 samples were collected by layer, direction, and point from the smelting experiment furnace wall, and XRD analysis was performed. These data were compared with the geothermometer method and the cluster analysis method to determine how to effectively interpret heated characteristics. As a result of comparing the heated characteristics of the 1st to 4th floors, its showed the same results for both methods because of heated by high temperatures in the 1st and 2nd floors heated. However, in the data from the 3rd and 4th floors, it was difficult to interpret the difference in heat temperature depending on the direction using the geothermometer method, but the cluster analysis method was able to effectively confirm the pattern of heat spreading from the center to the outside of the furnace wall. As a result, the cluster analysis method can reduce errors that may appear due to mineral identification in the process of estimating heat temperature using the geothermometer method and there is an advantage in that the temperature distribution within the furnace wall can be further refined.
1. INTRODUCTION
In order to investigate ancient iron-making technology, the most effective method would be to study materials produced in the process of making iron, such as iron ore, slag, and iron products. Therefore, the focus so far has been on analyzing materials related to iron production. However, another important object of study in the process of making iron is the furnace wall.
The furnace wall refers to the wall that forms the furnace in the iron making process. It maintains temperature, secures oxidation and reduction space, and often plays the role of a flux in the metal melting process (Kang, 2011). Since these furnace walls must maintain their function for a long time at high temperatures, various materials other than clay are mixed and used. In some ruins, it has been confirmed that straw and grass were mixed to increase the cohesion of the clay, so the construction of furnace walls varies depending on the region or period, and it is closely related not only to the nature of the ruins that produced iron, but also to the production technology.
Research on furnace walls began with an archaeological attempt to classify the characteristics of the ruins and the type of furnace walls built according to the type of iron produced. Initially, natural scientific research was mainly conducted to indirectly estimate the working temperature of the furnace by studying iron products and slag, rather than focusing on the furnace wall. Afterwards, interest began in earnest as materialological research on furnace walls excavated from the Songdu-ri ruins in Jincheon, Chungcheongbuk-do and scientific analysis of Joseon Dynasty furnace walls excavated in the southern region of the Korean Peninsula were conducted. However, even in these studies, it is difficult to reveal the technical characteristics or working properties of the relevant ruins by analyzing only 1 to 2 furnace wall samples. In addition, because only the lowest layer of the furnace wall excavated from the ruins remains, there was a limitation in confirming the thermal characteristics of the upper furnace wall above it.
The method of confirming thermal properties has traditionally been estimated based on the presence or absence of constituent minerals using the geothermometer method. However, when there are many samples that change continuously, it is difficult to determine the pattern of change, so it is advantageous to use statistical analysis methods. The cluster analysis method expresses the quality of clustering and is advantageous when analyzing many samples, and has been used in studies on estimating the firing temperature of clay bricks (Han et al., 2016) and on mineralogical changes in ceramic samples (Lara Maritan et al., 2015) and other papers.
In this study, a smelting experiment was conducted at the National Jungwon Cultural Heritage Research Institute to reveal the smelting process of iron, and the crystal structure characteristics of the constituent minerals were analyzed for the experimental furnace wall obtained in the process. Then, after processing these data using geothermometer method and cluster analysis method, we attempted to compare and analyze the thermal characteristics of the furnace wall according to height, direction, and point within the furnace wall. In particular, because the temperature estimation range of the geothermometer method is very wide, the cluster analysis method was applied to compensate for its shortcomings, and as a result, we sought to determine how effective the latter method is.
2. SAMPLES
The samples subject to analysis were smelting furnaces in which the 4th to 7th smelting experiments were conducted at the National Jungwon Cultural Heritage Research Institute, and were collected by cutting the furnace vertically.
The model of the smelting furnace is Iron Making Relic No. 3 excavated from the 392-5 Chilgeum-dong, Chungju in Baekje period (Figure 1). The size of the furnace is 120 cm in inner diameter, 280 cm in height, 40 cm in depth, and 25 to 40 cm in thickness based on the bottom (National Jungwon Research Institute of Cultural Heritage, 2017). Samples were collected from a total of 19 locations according to height and direction from the cut furnace wall. For each big sample, points with color changes were identified based on the cross section, and subdivided into 4 to 5 layers going from the inside of the furnace wall (high-temperature heat layer) to the outside (Figure 1).
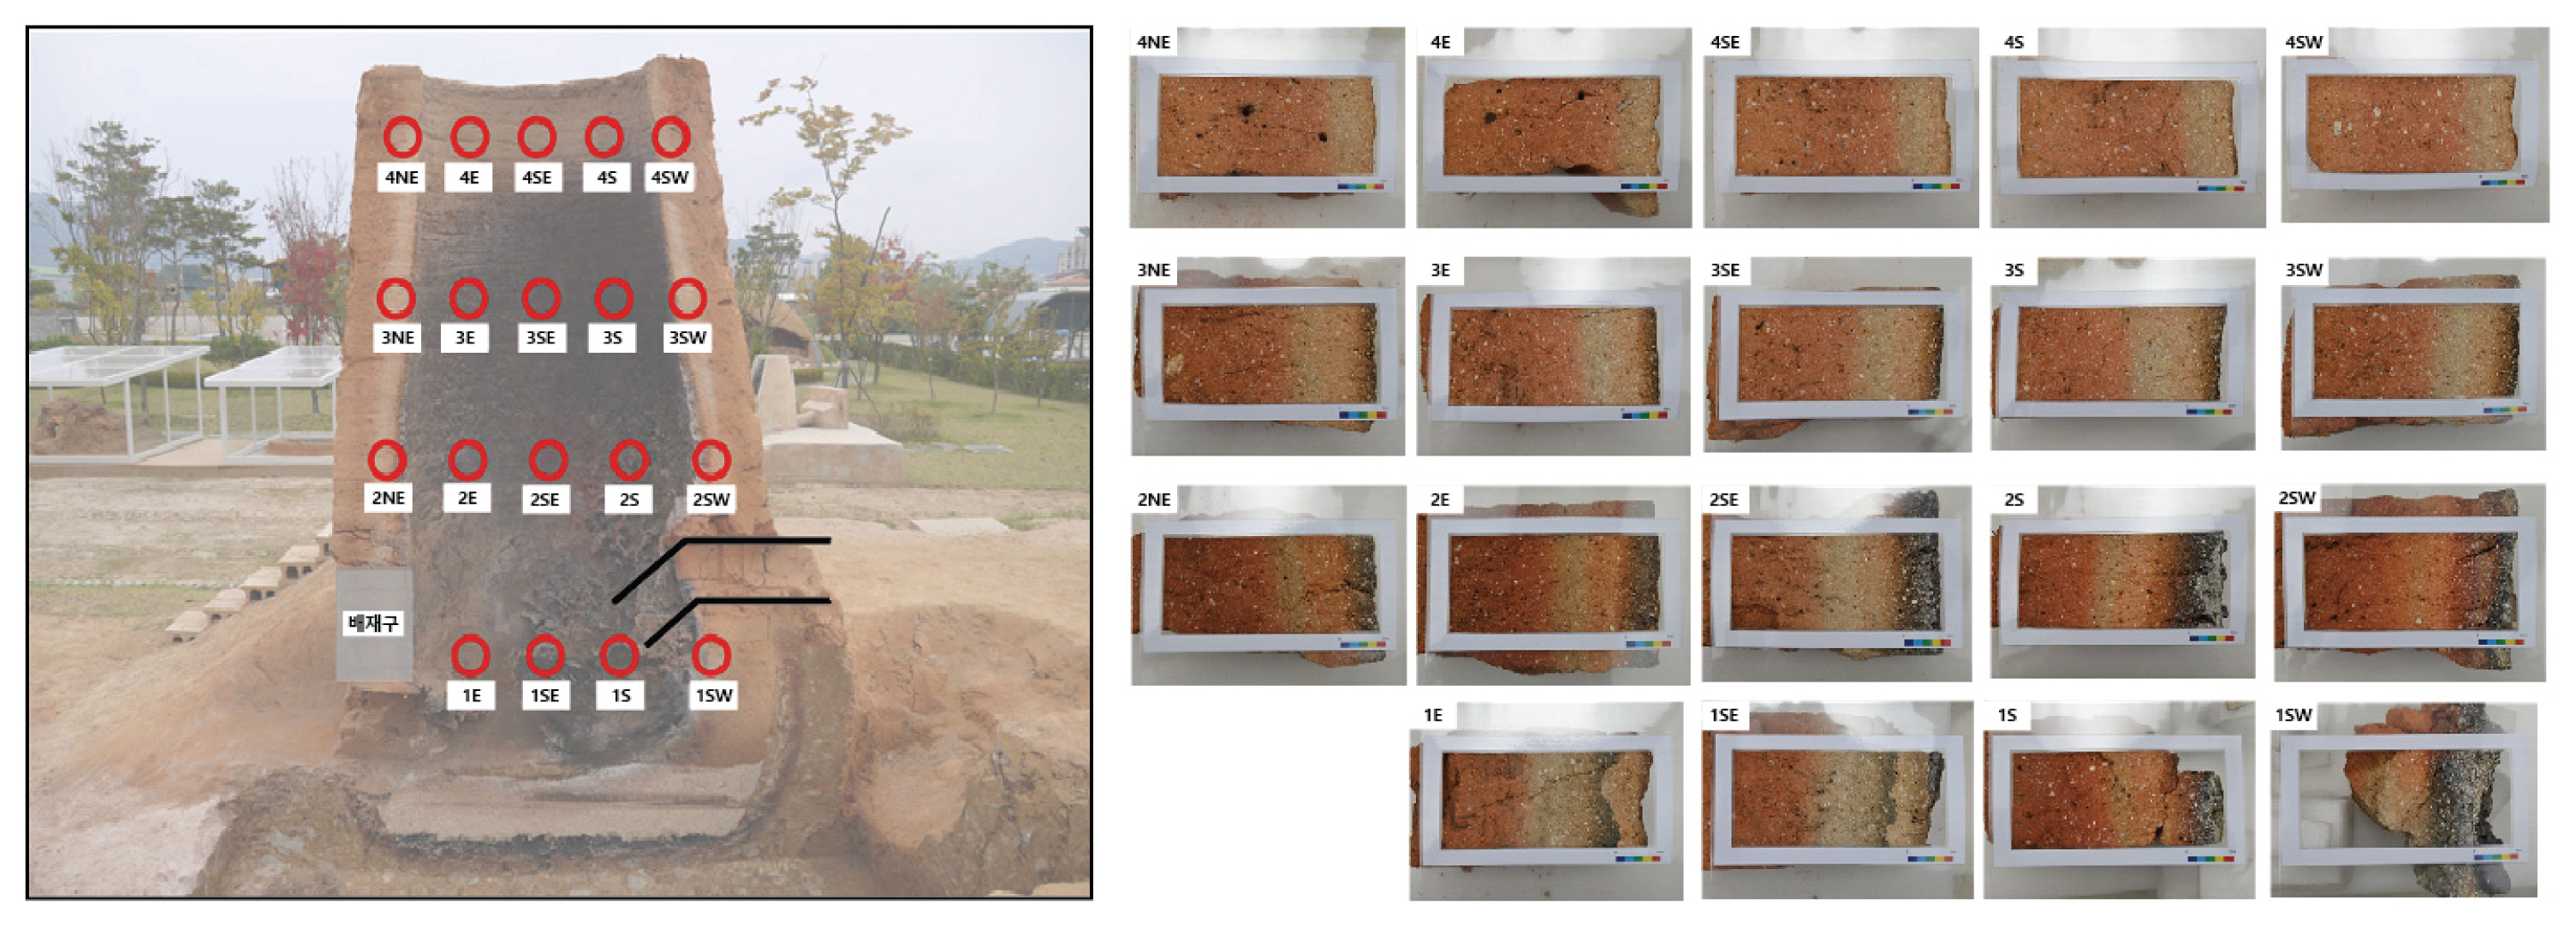
Cutting surface of the smelting furnace wall and point of sample collected (left), cross-sectional photo of big samples (right) (provided by the National Jungwon Research Institute of Cultural Heritage).
3. METHODS
Currently, there are various methods for estimating the heated temperature (or firing temperature), including thermal (ex, TG-DTA) analysis and crystal structure analysis of constituent minerals. However, the method of estimating the heated temperature using the geothermometer method to determine the presence or absence of minerals and their changes according to heating process is commonly used. As the firing temperature rises, new minerals appear or disappear due to decomposition or phase transition of minerals, and when fired at high temperatures, they sometimes melt to form glass (Han et al., 2016). However, estimating heated temperature using this geothermometer method has the disadvantage that the range of heated temperature is estimated to be rather wide depending on the types of constituent minerals. So it is not easy to determine the pattern of change in heated temperature depending on the height and point of the smelting furnace. In this study, to got diffraction patterns of samples using X-ray diffraction analysis and performed cluster analysis using the data. After confirming the pattern of change in the results derived from the cluster analysis method and attempted to confirm the heated temperature characteristics inside the smelting furnace by comparing it with the existing geothermometer method.
To confirm the constituent minerals of each samples, crystal structure analysis was performed using an X-ray diffractometer (Smart Lab, Rigaku, JPN). The samples were powdered using a mortar and pestle, placed in a glass vial, dried at 105°C for more than 24 hours, and analyzed by fixing a portion of the powdered sample in a XRD holder. The measurement conditions were 40 kV, 40 mA, 2 deg/min, scan step 0.02 deg, 5~90 deg. The diffraction pattern of the samples obtained through an X-ray diffraction analyzer were used to identify constituent minerals using X’Pert HighScore Plus software. Based on the presence or absence of these minerals, the heated temperature was estimated using the geothermometer method, and the change patterns s in the diffraction data were compared and analyzed through cluster analysis.
4. RESULTS
4.1. Heated temperature of smelting furnace wall samples using geothermometer method
Each samples were analyzed by XRD from the inside (high-temperature heat layer) to the outside of the smelting furnace wall according to the layer level and direction, and the constituent minerals were indentified. As a result of indentifying the constituent minerals by layer and direction, it was determined that the inside of the furnace wall was heated at a higher temperature than the outside, and it was confirmed that the first floor was heated at a higher temperature than the fourth floor. The estimated heated temperature using the geothermometer method is shown in Table 1.
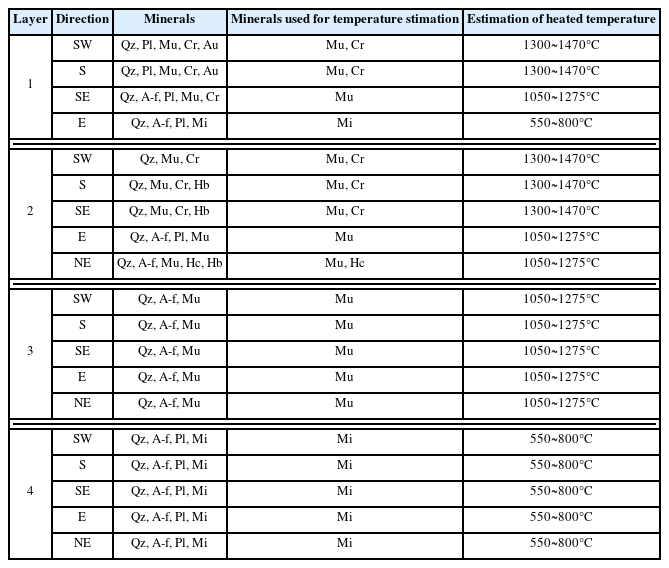
Estimated heated temperature of samples on the smelting experiment furnace wall (by layer and orientation) using the geothermometer method
First, the heated temperature in each direction of the first floor was highest on the inside of the furnace wall (high temperature heated layer), and the constituent minerals were the same in the southwest (SW) or south (S). In other words, since the high-temperature minerals mullite (Mu) and cristobalite (Cr) were identified, the heating temperature is estimated to be 1300~1470°C. In the southeast (SE), mullite (Mu) was identified and is estimated to be between 1050 and 1275°C, but in the east (E), there is no kaolinite, and mica (Mi) has been identified, so the heat temperature is estimated to be 550~800°C.
In the case of the second floor, the heat temperature and constituent minerals are almost the same in the southwest (SW), south (S), and southeast (SE) for the inside of the furnace wall (high-temperature heated layer). And the high-temperature minerals mullite (Mu) and cristobalite (Cr) was identified and the heat temperature was estimated to be about 1300~1470°C.
In the case of the third layer, regardless of the direction inside the furnace wall (high-temperature heat layer), the constituent minerals are almost the same such as quartz (Qz), alkali feldspar (A-f), and mullite (Mu). And mullite (Mu), a high-temperature mineral, was identified, and its heating temperature is estimated to be approximately 1050–1275°C.
In the case of the 4th floor, the estimated heating temperature inside the furnace wall (high-temperature heating layer) in each direction is the same regardless of the direction, and the constituent minerals are quartz (Qz), alkali feldspar (A-f), plagioclase (Pl), and mica (Mi). There is no kaolinite, and mica (Mi) has been identified, so the heat temperature is estimated to be about 550~800°C.
4.2. Heated temperature according to the layers of the smelting experiment furnace wall using cluster analysis
The types of constituent minerals according to the layers and directions of the smelting experiment furnace wall were identified, and the heated temperature was analyzed using the geothermometer method.
In the case of the 4th floor, since no high-temperature minerals were identified, it is judged to have received less heating compared to other floors (1st, 2nd, and 3rd floors). In addition, it was confirmed that the heated temperature tends to decrease toward the top depending on the layer. However, if the estimated range of heated temperature using the geothermometer method is wide and the peaks of mullite and cristobalite found at high temperatures are weak, there is a possibility of making an error in estimating the heated temperature. Therefore, in this study, instead of estimating the heated temperature by confirming the type of constituent minerals, cluster analysis was performed using XRD data. Then, the difference in heated temperature depending on the layer was confirmed through the change pattern of the X-ray diffraction data shown in the cluster analysis.
As a result of cluster analysis on samples corresponding to the inside of the furnace wall, it can be seen that the heated degree of the furnace wall increases in the order of 4th floor → 3rd floor → 2nd floor → 1st floor. This is consistent with the trend of change in heated temperature by layers using the geothermometer method. However, changes patterns according to direction within a layers and differences in heated range between layers can be seen more clearly (Figure 2).

Graph of the cluster analysis results using X-ray diffraction patterns of samples from each layer on the furnace wall of the smelting experiment.
4.3. Heated temperature according to the directions of the smelting experiment furnace wall using cluster analysis
As mentioned before, the geothermography method may have errors in estimating the heated temperature if the diffraction peak of the mineral identified at high temperature is weak. In particular, the furnace wall is divided into 4 to 5 ranges from the inside (high-temperature heated layer) to the outside (low-temperature heated layer) of the furnace wall in the same direction, and this is because the heated characteristics of the furnace wall are different. Therefore, when estimating the heated temperature using a geothermometer method, the distinction may not be available. In fact, when estimating the heated temperature using the geothermometer method, it appears that the inside of the smelting experiment furnace wall is consistently heated to a high temperature regardless of the layers and directions. So, in the middle range of the furnace wall, the difference in heated temperature cannot be confirmed because the mineral composition is the same. Therefore, cluster analysis was conducted to examine the change in heated characteristics by points (change from inside to outside) according to change in direction based on the layers.
A total of 21 samples were collected from the inside to the outside of the furnace wall according to the direction (SW, S, SE, E) in the first floor of the smelting experiment furnace wall, and as a result of cluster analysis, they were largely divided into four groups. Regardless of the all direction, it can be seen that the further inside the furnace wall is, the higher the heated temperature becomes. The change trend of it is judged that the SW direction is the point where the heated temperature is the highest, that is to say, it is the highest as it moves toward the tuyere (Figure 3A).

Result graphs of cluster analysis using the X-ray diffraction patterns for the samples at each point according to the direction on the furnace wall of smelting experiment (A: 1st layer samples, B: 2nd layer samples, C: 3rd layer samples, D: 4th layer samples).
A total of 25 samples were collected from the inside to the outside according to direction (SW, S, SE, E, NE) on the second floor of the smelting experiment furnace wall, and as a result of cluster analysis, they were roughly divided into five groups. Regardless of the all direction, it can be seen that the further inside the furnace wall is, the more heated at higher heating temperatures. In terms of change trends, directions other than the east (E) direction are distributed within the same heated group, and it is confirmed that furnace walls in other directions are heated at relatively high temperatures compared to the east (E) direction. In addition, when analyzing the change trend within the same group, the heated temperature in each direction of the second floor is interpreted to have been heated at a high temperature in the order of E → NE → SE → SW → S (Figure 3B).
A total of 25 samples were collected from the inside to the outside according to direction (SW, S, SE, E, NE) on the third floor of the smelting experiment furnace wall, and as a result of cluster analysis, they were roughly divided into five groups. Regardless of the all direction, it can be seen that the further inside the furnace wall is, the more heated at higher heating temperatures. The heated temperatures in the southeast (SE) and south (S), and in the east (E) and southwest (SW) are similar. In terms of change trends, in the case of the third floor, it is interpreted that high temperature heated occurred in the direction NE → SW → E → S → SE (Figure 3C).
A total of 20 samples were collected from the inside to the outside according to direction (SW, S, SE, E, NE) on the third floor of the smelting experiment furnace wall, and as a result of cluster analysis, they were roughly divided into five groups. Regardless of the all direction, it can be seen that the further inside the furnace wall is, the more heated at higher heating temperatures. East (E), southeast (SE), and south (S) belong to the same heated group and are distinct from northeast (NE) and southwest (SW). It is interpreted that the former was heated at a relatively higher heated temperature than the latter (Figure 3D).
5. DISCUSSION AND CONCLUSION
Relics such as earthenware, stoneware, ceramics, roof-tiles, and bricks made from clay undergo various changes during the production process depending on not only the firing temperature, but also the firing atmosphere and firing time. Based on these physical and chemical changes, the technical characteristics at the time of manufacturing the relics is determined. From the past to the present, estimating the firing temperature is of great interest, and methods such as thermal analysis and crystal structure analysis are used to reveal this. In particular, since clay contains quartz, alkali feldspar, plagioclase, mica (biotite, muscovite), illite, kaolinite, etc., as the firing temperature increases, these minerals undergo decomposition or phase transition processes and disappear or create new minerals.
So, this phenomenon is used to estimate the firing temperature (Han et al., 2016). However, in the case of materials made of various minerals, it is difficult to distinguish if the X-ray intensity is very low or overlaps with the peaks of some other minerals, so care must be taken when identifying minerals. Based on the results of mineral identification, the temperature range is wide when estimating the heated temperature using the geothermometer method for commonly known minerals, and it is difficult to distinguish between minerals with similar compositions.
In this study, it interpreted in depth the heated characteristics of the smelting experiment furnace wall by comparing the change heated patterns of XRD data using the geothermometer method to estimate the heated temperature and the cluster analysis method. When estimating the heated range of the smelting experiment furnace wall using the geothermometer method, each layer is roughly divided into 550~800°C, 1050~1275°C, and 1300~1470°C. In the case of the 1st and 2nd floors, the direction of the tuyere showed the highest heating temperature, and the direction of the outlet showed relatively low heated temperatures. However, the east side (E) of the first floor shows the lowest heated temperature range (550~800°C), which is interpreted to be related to the amount of air flowing into the outlet in the furnace wall. In the case of the 3rd and 4th floors, the heated temperature ranges is estimated to be 1050~1275°C and 550~800°C. This is because direct heat transfer appears to be possible from the vent to at least the 3rd floor, and relatively, the heated temperature ranges from the 4th floor and above, it is interpreted as having little influence.
The National Jungwon Cultural Heritage Research Institute (2021) directly measured the working temperature data of the furnace wall using a thermocouple during a smelting experiment. As a result of checking the temperature in each direction on the second and third floors inside the actual smelting experiment furnace wall using this, it can be seen that the southwest (SW) was 1200°C and the northeast (NE) was around 1000°C. It has been confirmed that the initial temperature and temperature increase rate vary depending on the height, and the final temperature reached varies depending on the direction. Since the heated characteristics in the furnace wall of the smelting experiment using the geothermometer method do not represent this, it may be misinterpreted as heat being transferred uniformly regardless of direction (Figure 4A).

Heated characteristics inside the smelting experiment furnace wall (A: Heated temperature distribution using geothermometer method, B: Heated temperature distribution using cluster analysis method).
From the cluster analysis results, it is judged that it is easy to identify the change pattern as the heated temperature increases for each layer and direction of the smelting experiment furnace wall. And that is possible to separate and analyze relative and detailed heated characteristics even if its diffraction pattern is same. When comparing the heated temperature for each layer and direction in the smelting experiment furnace wall estimated based on the results of this cluster analysis with the geothermography method, there is a limit to narrowing the range of heat source temperature according to layer level and direction, but differences in relative heated temperature can be distinguished among simillar points. The heated temperature decreases as go up to the 4th floor. In the case of the 2nd floor, the heated temperature is higher on the tuyere side and tends to be lower towards the outlet. The northeast (NE) has a higher heat source temperature than the east (E). This is estimated to be relate on the flow of air flowing inside the furnace. In the case of the 3rd and 4th floors, it is difficult to distinguish the distribution pattern of heated temperature using the geothermometer method. However, using the cluster analysis method, differences in heated temperature can be confirmed depending on the direction, and the pattern of heat spreading from the center of the furnace wall to the outside can be confirmed (Figure 4B).
In conclusion, if the basic heated temperature is estimated based on the geothermometer method and the cluster analysis method is applied in parallel using X-ray diffraction pattern data, the characteristics and change patterns of the heated temperature can be more accurately determined by layer, direction, and location of the furnace wall. By further subdividing the temperature distribution inside the furnace, the overall heat flow can be estimated and errors that may occur when using geothermometer method which is mineral identification can be reduced.
ACKNOWLEDGMENT
This paper is written by additional analysis and in-depth interpretation based on a portion of the 2019 report on the natural science analysis of the iron smelting experimental furnace wall in the National Jungwon Research Institute of Cultural Heritage.